
2025 IMPACT REPORT
Antisemitism
doesn't stand
a chance.
After three months of JewBelong’s big, bold pink billboards in Kansas City, MO, non-Jewish residents reported major shifts in how they see and respond to antisemitism. From getting emotional to realizing that fighting antisemitism is urgent, the data proves what we already know: billboards work.
changing attitudes
After the billboard campaign, there was a significant shift in non-Jewish attitudes about antisemitism:
Increase in: “Combating antisemitism is an urgent issue”
Increase in: “I actively speak up about antisemitism”
Increase in: “I feel scared for Jewish people in the country”
Increase in: “The U.S. needs to
take antisemitism seriously”
Increase in: Feeling that antisemitism is personally relevant
Reported at least one negative emotional impact (sadness, anger, fear, shock) from news of antisemitic violence
Believe antisemitism
is rising in the U.S.
Remembered seeing at least one JewBelong billboard
Message testing
and recall
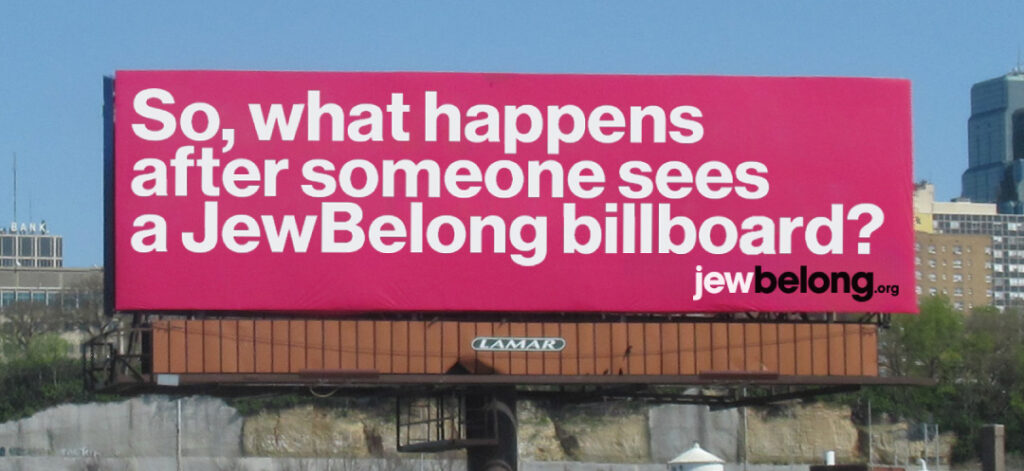
JewBelong chose the four strongest billboard lines based on pre-campaign testing results. 33% of people overall remembered seeing a JewBelong billboard while recall by sign varied slightly.
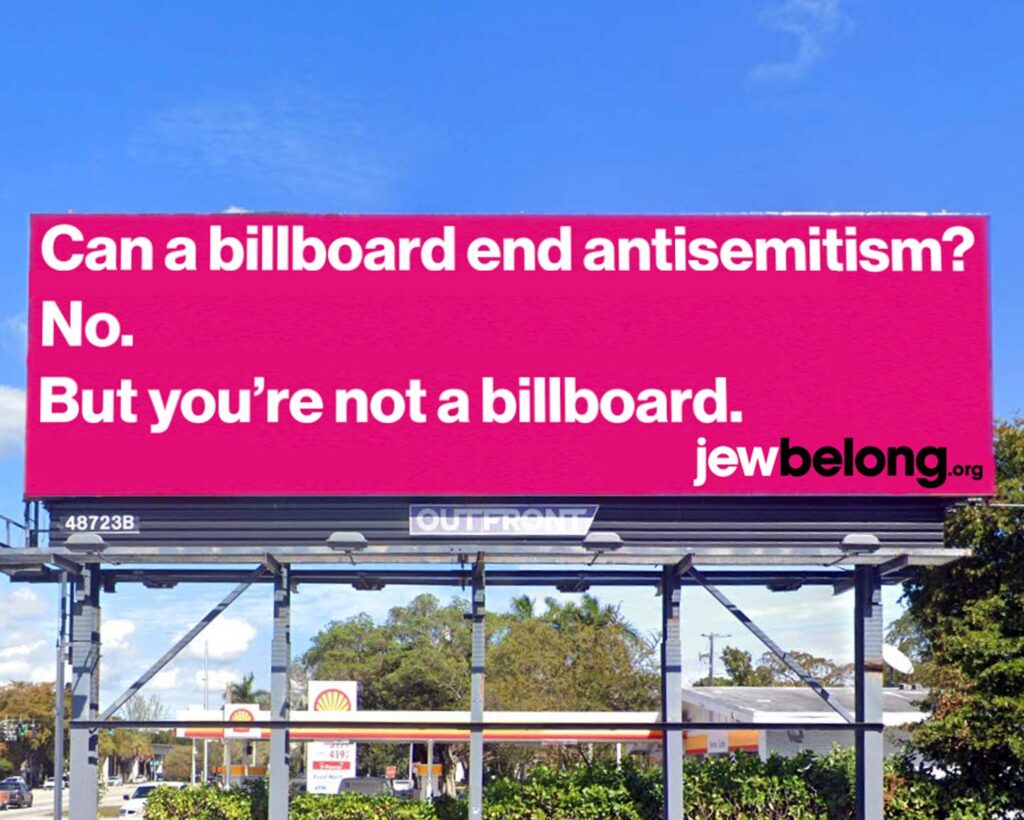
13% recall
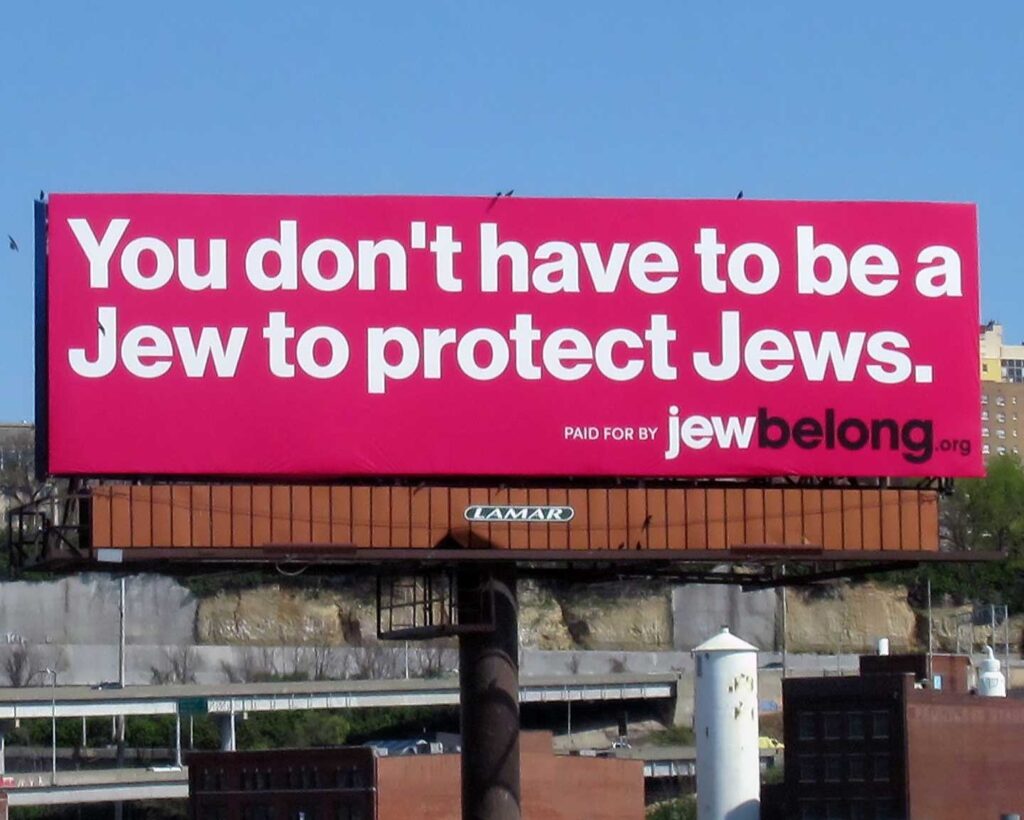
22% recall
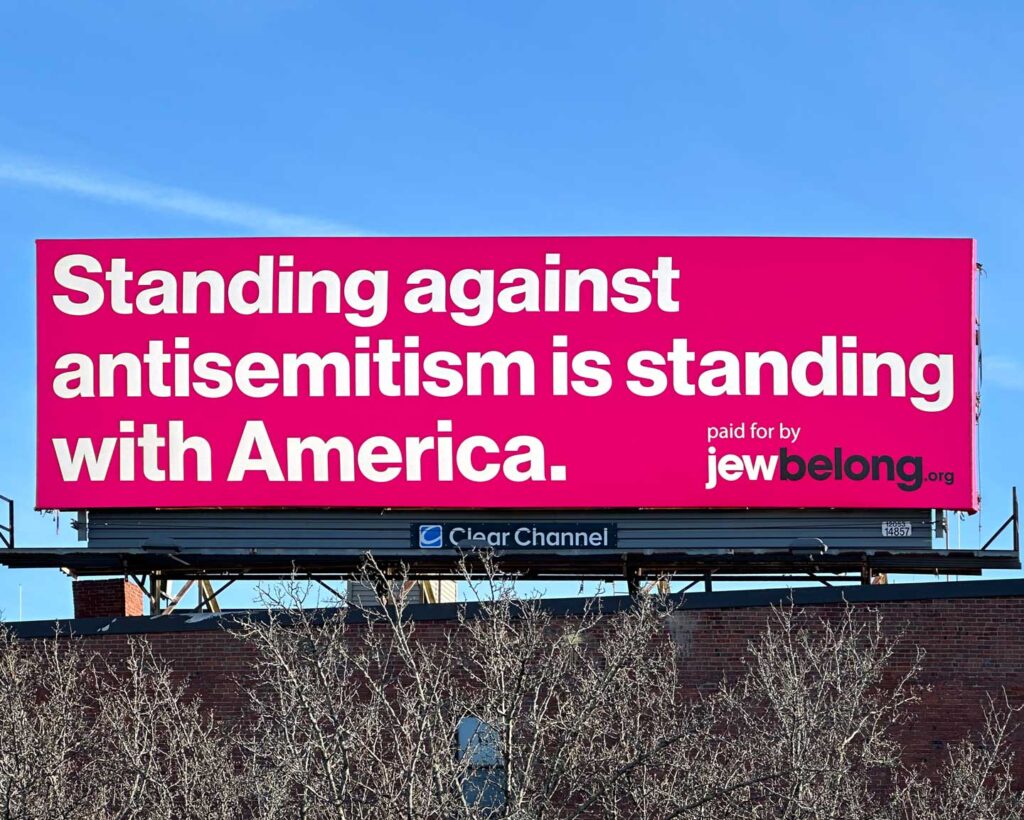
16% recall
13% recall
methodology
JewBelong’s goal was to measure attitude shifts and message recall based on a three-month billboard campaign flanked by pre- and post-campaign surveys. Inclusion criteria included being a non-Jewish resident of the metro area surrounding Kansas City MO, an area where Jews comprise less than 1% of the population. Results include responses from over 2,000 randomly chosen respondents. The study was conducted by R/GA, a global research firm.
Scroll below to read the details!
SURVEY SETUP
Fieldwork
- Pre-Campaign: Quant survey fielded 3/10/2025 – 3/24/2025
- Post-Campaign: Quant survey fielded 06/18/2025 – 06/30/2025
- Hosted in the Forsta Surveys market research platform
- Sample sourced via Cint Marketplace & Pure Spectrum
Screener criteria
- Age 18-74
- US resident, limited to Kansas City metro (counties included: Jackson, MO: Johnson, KS; Clay, MO; Wyandotte, KS; Cass, MO; Platte, MO)
- Rural counties were excluded because they were likely not going to be exposed to the campaign
- 90% of the KC DMA population qualified
(but only 6 of 33 counties in the DMA qualified) - Middle of the road on their concern about antisemitism
- Q: How concerned are you about each of the following topics?
Antisemitism.
Disqualified if select 1-Not at all concerned or 5-Very concerned,
Allow if select 2, 3 or 4.
Survey Structure
- Screener
- Key measures
- Message recall
- Post-Campaign additional questions
- Profile points
- Additional demographics
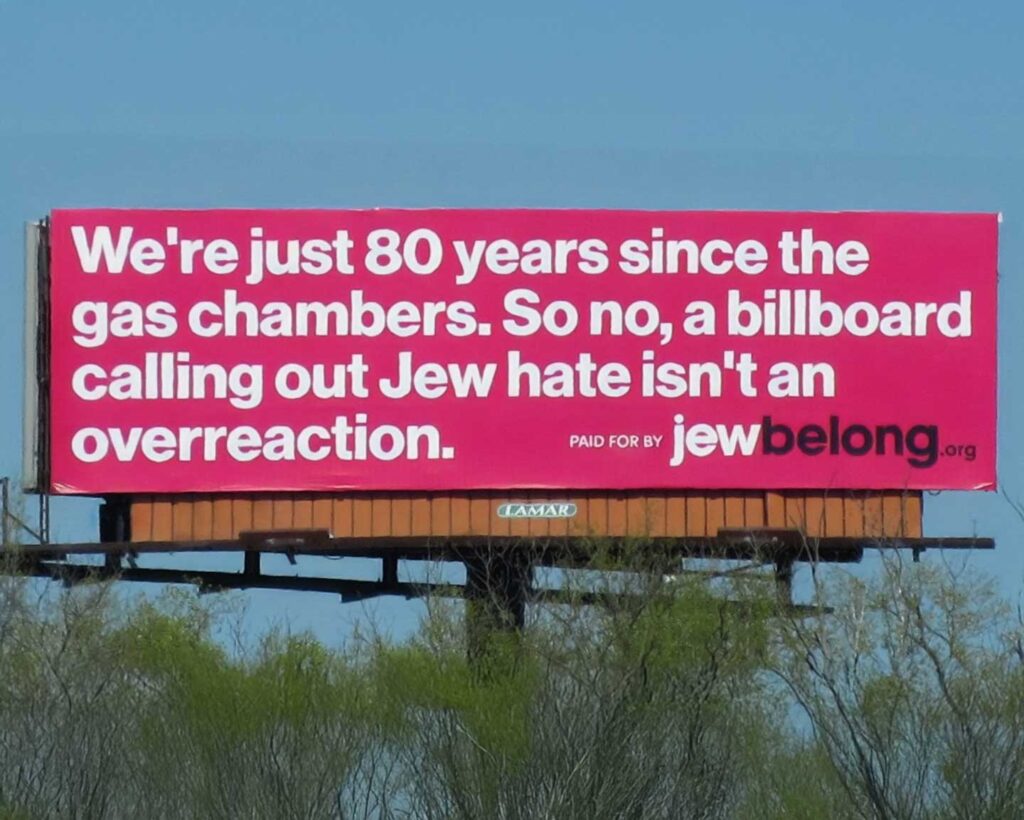
Stimulus (Post campaign) 4 OOH boards tested for ad recall:
- Billboard Antisemitism
- Overreaction
- Standing w America
- You don’t need to be a Jew
Respondents were shown images of the ads that were run in Kansas City during the campaign.
DEMOGRAPHICS
Gender
- Female – 63% (post-campaign); 61% (pre-campaign)
- Male – 36%; (38%)
- Other – 1% (1%)
Age
- 18-34 – 34% (33%)
- 35-49 – 38% (36%)
- 50+ – 27% (31%)
HH Income
- Under $50,000 – 39% (40%)
- $50,000 – $74,999 – 22% (23%)
- $75,000 – $99,999 – 15% (13%)
- $100,000 – $149,999 – 13% (13%)
- $150,000 – $199,999 – 5% (4%)
- Over $200,000 – 3% (3%)
- Don´t know/ Prefer not to answer – 4% (4%)
Marital Status
- Married – 36% (37%)
- Living with partner/significant other – 14% (16%)
- Single, never married – 34% (32%)
- Separated or divorced – 12% (11%)
- Widowed – 4% (4%)
Political Outlook
- Very conservative: 10% (10%)
- Somewhat conservative: 20% (22%)
- Middle of the road: 44% (44%)
- Somewhat liberal: 16% (15%)
- Very liberal: 9% (9%)
Employment
- Employed full-time (30+ Hours/Week) – 51% (49%)
- Employed part-time (Under 30 Hours/Week) – 11% (13%)
- Not employed, looking for work – 9% (7%)
- Not employed, not looking for work – 2% (1%)
- Homemaker/care for my children full time – 6% (6%)
- Full-time student – 3% (3%)
- Retired – 8% (11%)
- Disabled, not able to work – 7% (6%)
- Other/prefer not to say – 2% (3%)
Education
- Some high school or less – 5% (5%)
- High school or equivalent – 27% (26%)
- Some college, but no degree – 22% (24%)
- Associate’s degree / Trade school degree 13% (14%)
- Bachelor’s degree or Graduate degree – 33% (32%)
Parent/guardian of children under 18 years old
- Yes – 43% (35%)
- No – 57% (65%)
Religion
- Other Christian: 28% (31%)
- Catholic: 18% (17%)
- Protestant: 12% (12%)
- Atheist/agnostic: 10% (10%)
- Spiritual: 10% (8%)
- Evangelical (Christian): 3% (3%)
- Jewish: 0% (1%)
- Muslim: 2% (1%)
- Other: 3% (5%)
- None: 14% (11%)
Survey setup
Fieldwork
- Pre-Campaign: Quant survey fielded 3/10/2025 – 3/24/2025
- Post-Campaign: Quant survey fielded 06/18/2025 – 06/30/2025
- Hosted in the Forsta Surveys market research platform
- Sample sourced via Cint Marketplace & Pure Spectrum
Screener criteria
- Age 18-74
- US resident, limited to Kansas City metro (counties included: Jackson, MO: Johnson, KS; Clay, MO; Wyandotte, KS; Cass, MO; Platte, MO)
- Rural counties were excluded because they were likely not going to be exposed to the campaign
- 90% of the KC DMA population qualified
(but only 6 of 33 counties in the DMA qualified) - Middle of the road on their concern about antisemitism
- Q: How concerned are you about each of the following topics?
Antisemitism.
Disqualified if select 1-Not at all concerned or 5-Very concerned,
Allow if select 2, 3 or 4.
Survey Structure
- Screener
- Key measures
- Message recall
- Post-Campaign additional questions
- Profile points
- Additional demographics
Stimulus (Post campaign) 4 OOH boards tested for ad recall:
- Billboard Antisemitism
- Overreaction
- Standing w America
- You don’t need to be a Jew
Respondents were shown images of the ads that were run in Kansas City during
the campaign.
Demographics
Gender
- Female – 63% (post-campaign); 61% (pre-campaign)
- Male – 36%; (38%)
- Other – 1% (1%)
Age
- 18-34 – 34% (33%)
- 35-49 – 38% (36%)
- 50+ – 27% (31%)
HH Income
- Under $50,000 – 39% (40%)
- $50,000 – $74,999 – 22% (23%)
- $75,000 – $99,999 – 15% (13%)
- $100,000 – $149,999 – 13% (13%)
- $150,000 – $199,999 – 5% (4%)
- Over $200,000 – 3% (3%)
- Don´t know/ Prefer not to answer – 4% (4%)
Marital Status
- Married – 36% (37%)
- Living with partner/significant other – 14% (16%)
- Single, never married – 34% (32%)
- Separated or divorced – 12% (11%)
- Widowed – 4% (4%)
Political Outlook
- Very conservative: 10% (10%)
- Somewhat conservative: 20% (22%)
- Middle of the road: 44% (44%)
- Somewhat liberal: 16% (15%)
- Very liberal: 9% (9%)
Employment
- Employed full-time (30+ Hours/Week) – 51% (49%)
- Employed part-time (Under 30 Hours/Week) – 11% (13%)
- Not employed, looking for work – 9% (7%)
- Not employed, not looking for work – 2% (1%)
- Homemaker/care for my children full time – 6% (6%)
- Full-time student – 3% (3%)
- Retired – 8% (11%)
- Disabled, not able to work – 7% (6%)
- Other/prefer not to say – 2% (3%)
Education
- Some high school or less – 5% (5%)
- High school or equivalent – 27% (26%)
- Some college, but no degree – 22% (24%)
- Associate’s degree / Trade school degree 13% (14%)
- Bachelor’s degree or Graduate degree – 33% (32%)
Parent/guardian of children under 18 years old
- Yes – 43% (35%)
- No – 57% (65%)
Religion
- Other Christian: 28% (31%)
- Catholic: 18% (17%)
- Protestant: 12% (12%)
- Atheist/agnostic: 10% (10%)
- Spiritual: 10% (8%)
- Evangelical (Christian): 3% (3%)
- Jewish: 0% (1%)
- Muslim: 2% (1%)
- Other: 3% (5%)
- None: 14% (11%)
Billboard Placements
JewBelong placed billboards along major roadways and close to downtown areas to target Kansas City urban and suburban residents.
Kansas city metro
sample area
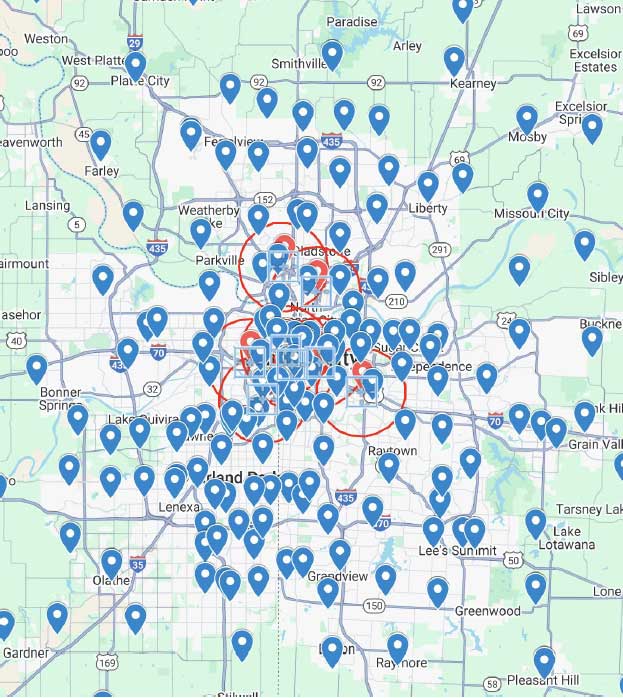
Each blue marker represents a qualifying ZIP code.
billboard
locations
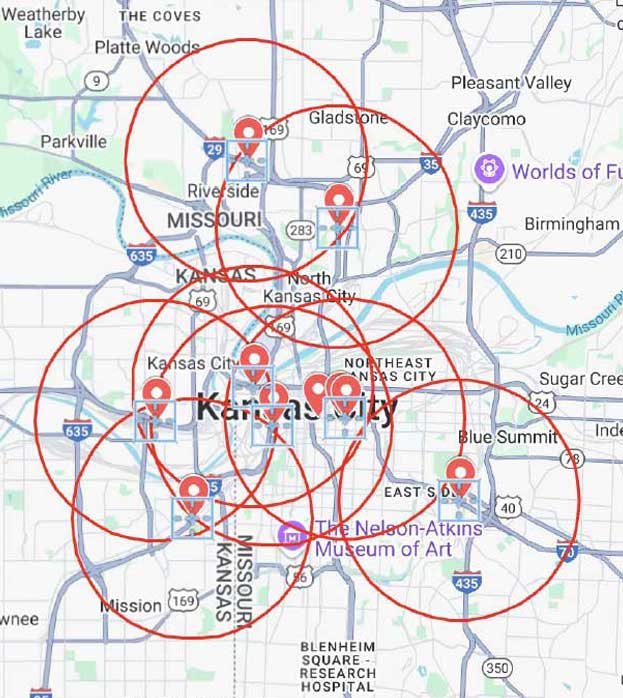
Red circles indicate 3 mile radius from OOH ad location.
additional quantitative insights
In assigning blame for the Israel—Hamas war, 54% said it was equally the fault of Israel and Hamas.
Only 34% of respondents knew what Zionism* means. Even after being shown a definition, 36% still said they didn't know enough to answer.
Most participants identified antisemitism as discrimination, hate crimes, and racism — but only ~41% recognized "denying Israel's right to exist" as antisemitism.
Identified Hamas as a terrorist group.
But 32% weren't sure.
*Zionism is the movement for the self-determination and statehood for the Jewish people in their ancestral homeland, the land of Israel. Zionists are people who believe in and support the right of the democratic State of Israel to exist as a Jewish homeland.
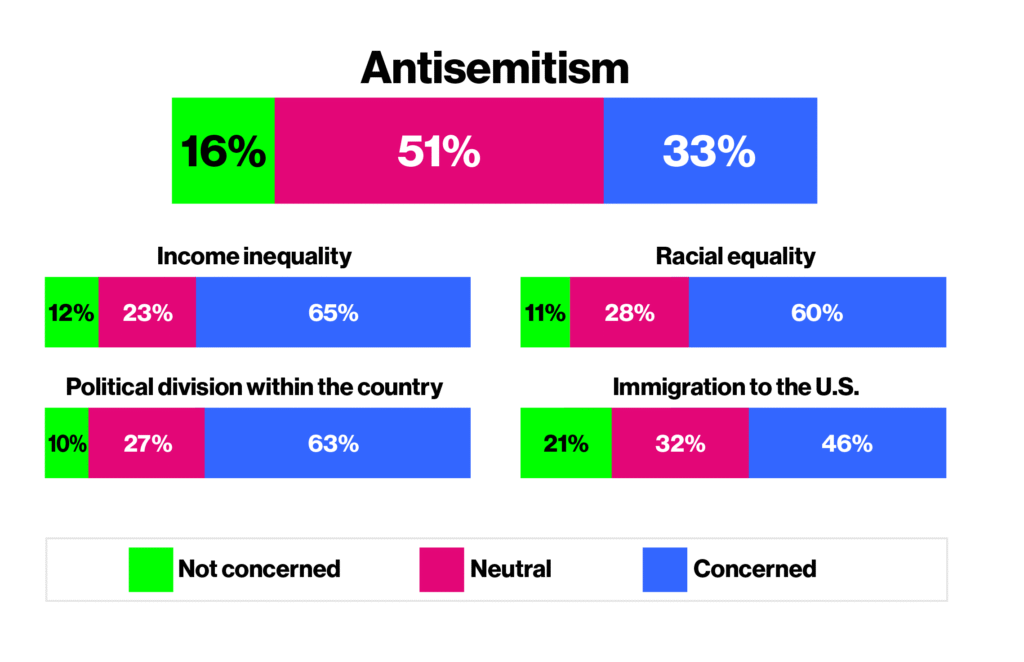
persuadables
Antisemitism is viewed with less societal concern compared to other key issues
Compared to other societal issues, antisemitism is not viewed as critical. In fact, 51% of respondents are neutral on whether it is a real concern. That means a majority of people remain persuadable to understanding the urgent and growing threat of antisemitism and those individuals are precisely JewBelong’s target market.
Additional
qualitative insights
The following notes were collected from respondents to the survey.